-
An incredibly rare bullish stock market indicator just flashed, suggesting more upside ahead.
-
The Zweig Breadth Thrust indicator flashed for the first time since 2019, according to Ryan Detrick of the Carson Group.
-
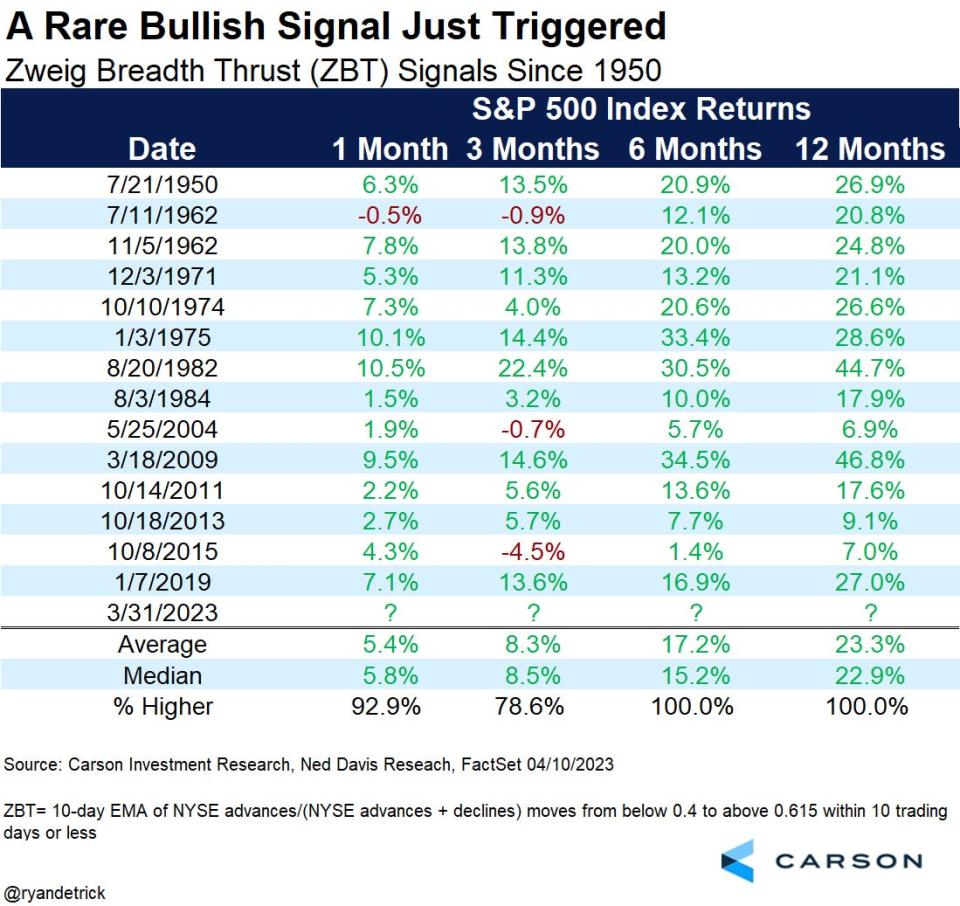
“It has only happened 14 other times since 1950 and the S&P 500 was higher a year later every single time,” he said.
An incredibly rare bullish stock market indicator just flashed for the first time since 2019, suggesting that the 18% rally in the S&P 500 that started in mid-October has more fuel to continue higher.
That’s according to Carson Group chief market strategist Ryan Detrick, who pointed out that the “extremely rare” Zweig Breadth Thrust Indicator just triggered.
It measures overall participation among individual issues in the stock market and was developed by investor and “Winning on Wall Street” author Martin Zweig.
The indicator is calculated by taking a 10-day moving average of the number of advancing stocks divided by the number of advancing stocks plus the number of declining stocks. The calculation derives a percentage, and when it falls below 40% then surges above 60% in 10 days or less, the indicator is triggered.
“Although the computation is a tad confusing, the bottom line is many stocks went from oversold to overbought in a short time frame,” Detrick told Insider on Monday. “This is what you tend to see at the beginning of new bullish phases.”
The last time the Zweig Thrust Indicator triggered was in early 2019. Before then, the indicator flashed in October 2015, October 2013, October 2011, and March 2009, just two weeks after the S&P 500 hit its generational low during the Great Financial Crisis.
“It has only happened 14 other time since 1950 and the S&P 500 was higher a year later every single time,” Detrick said, adding that both the average and the median forward one-year return was 23%. Meanwhile, the six-month forward average return after the Zweig Thrust Indicator triggered is 17%.
Only two instances since 2000 has the Zweig Thrust Indicator flashed and the S&P 500 went on to fall to a new low: in late 2015 and early 2004. However, while the S&P 500 did move lower in the short term, the index still moved significantly higher one year after the signal was triggered.
There have been several breadth thrust indicators that flashed during the ongoing bear market rally last summer. But notably none of them were the Zweig Breadth Thrust Indicator, and they ultimately proved to be a false signal as the S&P 500 went on to fall to new lows.
“Last summer’s big rally didn’t see a Zweig Breadth Thrust Indicator, as that rally faltered eventually. So maybe this is another clue that this rally off the October lows is legit,” Detrick said.
Mark Ungewitter, portfolio manager at the Charter Trust company, said the Zweig Thrust Indicator is unique in that it “adds a dimension of ‘speed’ via exponential moving average, to a standard measure of intensity.”
And while the indicator is not a foolproof sign that the pain in stock market is over, it’s definitely a good sign for bullish investors. “Definitely not bearish, though perhaps not immediately bullish,” Ungewitter said.

Read the original article on Business Insider


